What Is NDVI and What Does It Measure?
NDVI — Normalized Difference Vegetation Index — is a remote sensing measurement that quantifies vegetation health using near-infrared light. The principle is straightforward: healthy plant tissue absorbs visible red light for photosynthesis and strongly reflects near-infrared light. Stressed or unhealthy vegetation absorbs less red light and reflects less near-infrared, producing a measurably different spectral signature.
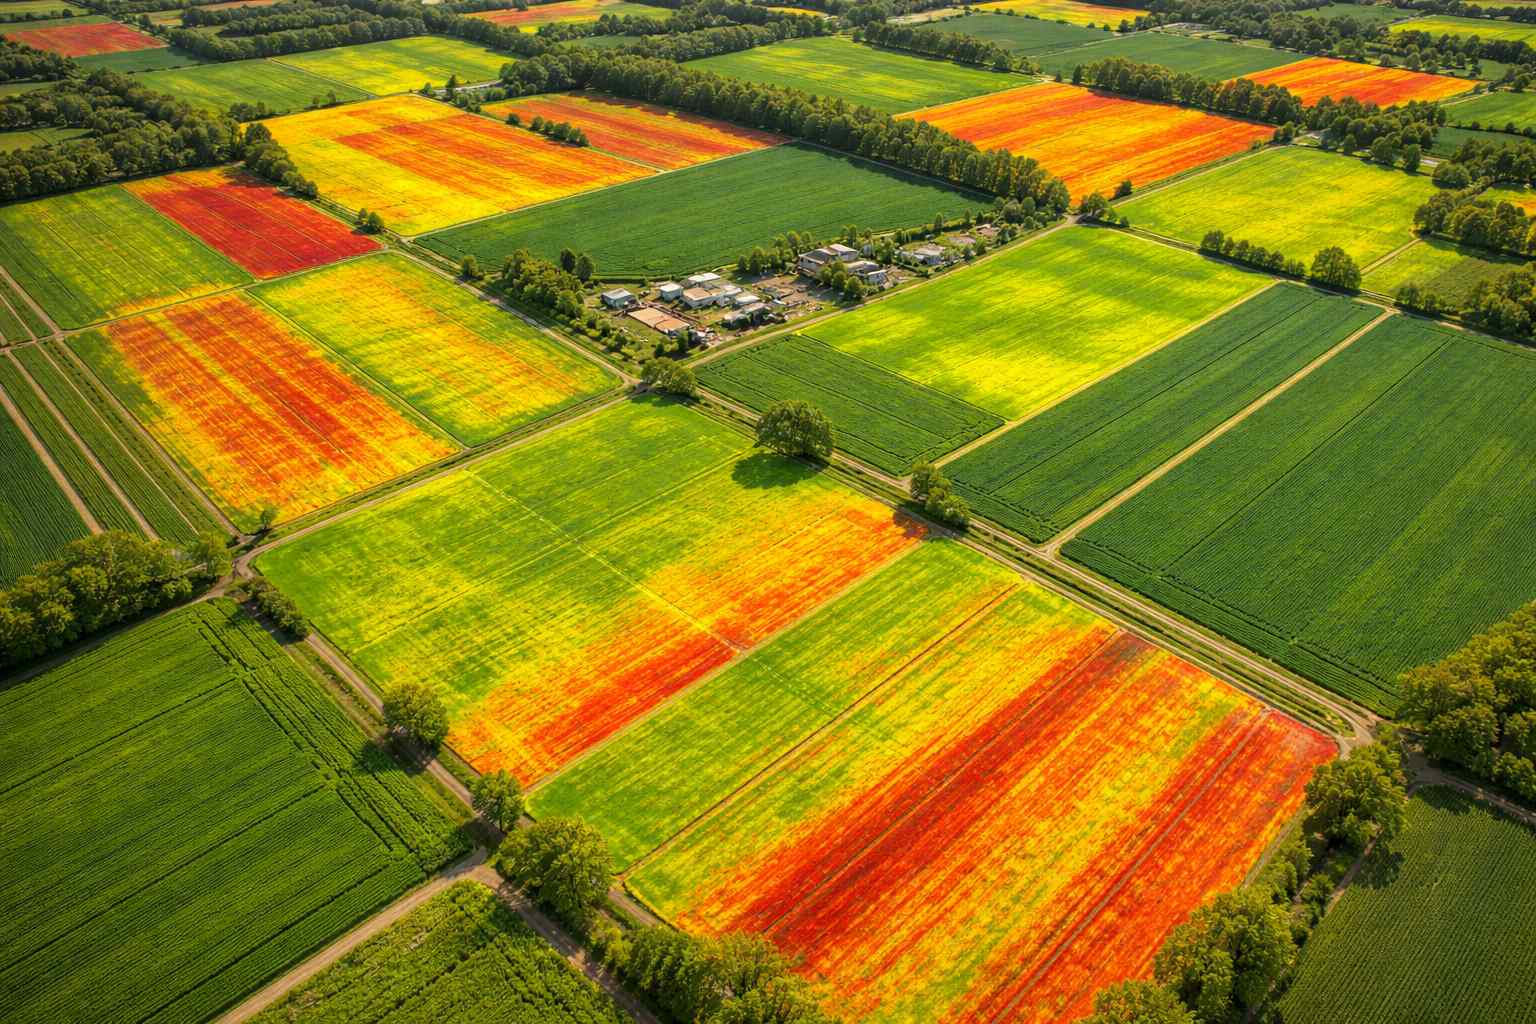
By capturing both near-infrared and visible red light simultaneously using multispectral sensors on the DJI Mavic 3 Enterprise, we generate a color-coded NDVI map of your entire property. Each pixel on the map represents a vegetation health value between -1 and +1. High values (shown in deep green) indicate vigorous, healthy vegetation. Low values (shown in yellow or red) indicate stress, dormancy, or bare ground. The map makes it immediately visible where your vegetation is thriving and where it needs attention — often detecting problems a week or more before they become visible to the naked eye.
For Florida's agricultural operations and land managers, NDVI provides an objective, repeatable measurement tool that removes guesswork from crop management. Instead of walking fields and estimating conditions visually, you get a data-driven view of every acre, every flight.
Florida Agricultural Applications
Citrus Groves
Monitor tree health across large acreages, detect citrus greening (HLB) stress patterns, and track grove recovery after treatment applications.
Sod Farms
Track turf health uniformity across production fields, identify irrigation coverage gaps, and verify harvest readiness by section.
Sugar Cane
Monitor stand establishment, detect nutrient deficiency zones, and assess crop vigor during the growing season for yield estimation.
Row Crops
Tomatoes, peppers, strawberries, and other Florida row crops benefit from early stress detection that enables targeted fungicide, fertilizer, and irrigation adjustments.
What You Receive
- Georeferenced NDVI vegetation health map with color-coded stress indicators across the entire property
- High-resolution RGB orthomosaic for visual reference and comparison to the NDVI overlay
- Annotated zone analysis identifying areas of concern with recommended follow-up actions
- Exportable GeoTIFF files compatible with GIS software and precision agriculture platforms
How NDVI Supports Precision Agriculture
Precision agriculture is the practice of managing crops at a zone level rather than treating entire fields uniformly. NDVI data is one of the foundational inputs that makes precision agriculture practical. By identifying which zones of a field are healthy and which are stressed, NDVI maps enable variable-rate application of fertilizers, fungicides, and irrigation — putting inputs only where they are needed, rather than broadcasting them across the entire acreage.
In Florida's agricultural environment, where input costs are high and environmental regulations around nutrient runoff are strict, the ability to reduce unnecessary chemical application has both economic and regulatory value. NDVI-guided variable-rate management reduces input costs, minimizes environmental impact, and maintains or improves crop quality by ensuring that every zone receives exactly the treatment it needs.
For golf course superintendents managing turf rather than row crops, the same NDVI principles apply. Monthly NDVI flights detect turf stress from heat, disease, compaction, or irrigation failure weeks before visible decline, enabling targeted treatment that keeps playing surfaces at championship quality.